Therapeutic antibodies are enjoying high growth rates in the pharmaceutical market. In 2013, 7 of the top ten best-selling global drug brands were monoclonal antibodies (mAbs). The main product characteristics to be analyzed in process monitoring and quality control are aggregation, fragmentation, glycosylation and charge heterogeneity. We present the fast analysis of mAb charge heterogeneity by cation exchange chromatography on TSKgel STAT columns.
Charge isoforms of proteins result from deamidation of asparagine or glutamine residues or from incomplete removal of the C-terminal lysine residue. Besides isoelectric focusing, ion exchange chromatography is the method of choice to analyze charge heterogeneity of proteins. TSKgel STAT columns are packed with a non-porous polymer based stationary phase. Proprietary surface modification technology ensures a high density of charged groups. Compared to traditional porous IEX phases this yields outstanding resolution of charged species at shorter analysis time. TSKgel STAT columns are available as weak cation-exchanger (WCX, carboxymethyl) and strong cation exchanger (SCX, Sulfopropyl). Best performance is achieved when the columns are used with low dead volume chromatography systems such as modern UHPLC systems.
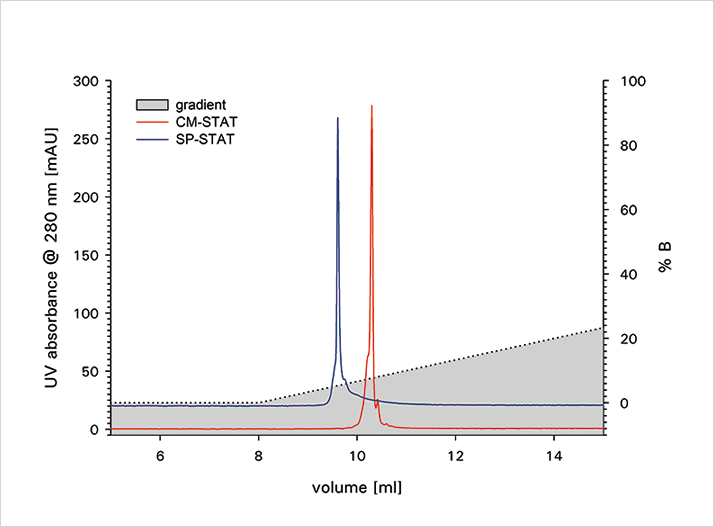
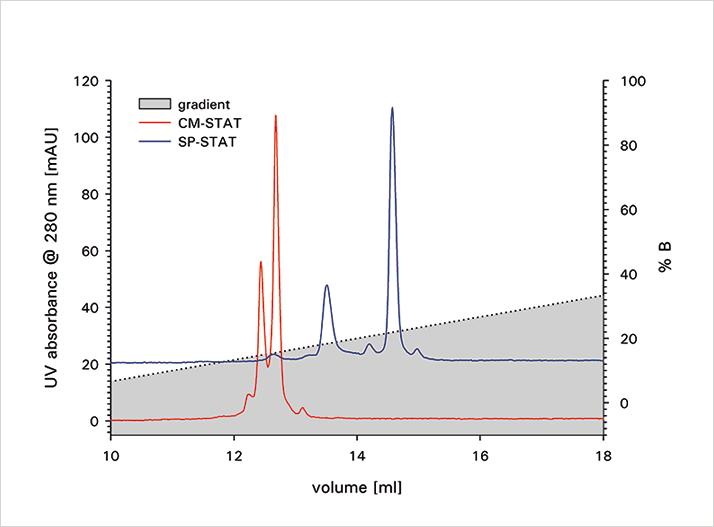
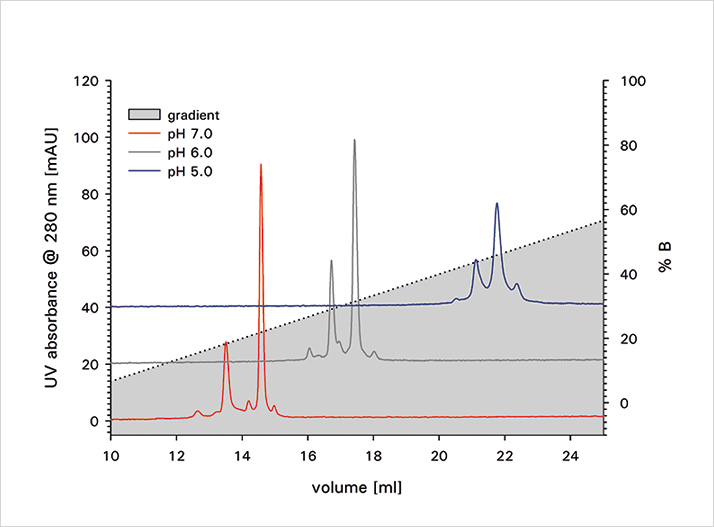
The charge isoforms of two monoclonal antibodies were separated on a TSKgel CM-STAT weak cation exchange column and a TSKgel SP-STAT strong cation exchange column. Figure 1 shows the analysis of mAb A on both columns at pH 7. For this IgG the weak cation exchange column delivers a better separation of the basic variant from the main peak. As shown in Figure 2 this is not the case for mAb B, where the strong cation exchange column shows a better separation. Retention and resolution of the charged isoforms are dependent on the buffer pH as can be seen in Figure 3 for the analysis of mAb B on TSKgel SP-STAT.
Weak and strong cation exchange columns provide different selectivities for the analysis of charge heterogeneity of proteins. In order to reach the best separation of acidic and basic isoforms from the main peak both types should be evaluated at various pH values of the mobile phase during method development. TSKgel STAT series columns provide a high resolution of isoforms in short analysis time and are ideally suited for the QC of biotherapeutics by UHPLC or HPLC.
Columns: TSKgel SP-STAT (7 µm, 4.6 mm ID x 10 cm); TSKgel CM-STAT (7 µm, 4.6 mm ID x 10 cm)
Mobile Phase A: 10 mmol/L sodium phosphate buffer pH 7.0 (Figure 1, 2, 3)
10 mmol/L sodium phosphate buffer pH 6.0 (Figure 3)
10 mmol/L sodium acetate buffer pH 5.0 (Figure 3)
Mobile Phase B: 100 mmol/L phosphate pH 7.0 + 500 mmol/L NaCl (Figure 1, 2, 3)
100 mmol/L phosphate pH 6.0 + 500 mmol/L NaCl (Figure 3)
100 mmol/L acetate pH 5.0 + 500 mmol/L NaCl (Figure 3)
Gradient: 0 - 100 % B in 30 min
Flow rate: 1 mL/min
Injection vol.: 10 µL
Detection: UV @280 nm
Sample: mAb A (2 g/L); mAb B (2 g/L)
Newsletters
Receive the latest analytical science news, personalities, education, and career development – weekly to your inbox.